


As much as we enjoy intricate build-up play, positional rotations, and player-for-player pressing structures, you cannot deny that a speculative shot or a searching pass can still be among the most enjoyable things to see in football.
That might be a rudimentary perspective, but those high-risk, high-reward actions are the things that fans pay their money for. They don’t always succeed, but when they do, they are worth the wait.
Advertisement
When sifting through the data, it is rather easy to determine which players eat up a lot of those riskier actions at the top end of the pitch. To outline exactly who, we can borrow an approach used for nearly 50 years in basketball — called “usage rate”.
In the NBA, this looks at the percentage of team plays ‘used’ by an individual player while they were on the court. The calculation is simply a player’s number of shots plus turnovers as a share of the team’s total shots and turnovers. Put simply, it allows you to outline how much a team’s sequences run through a specific player.
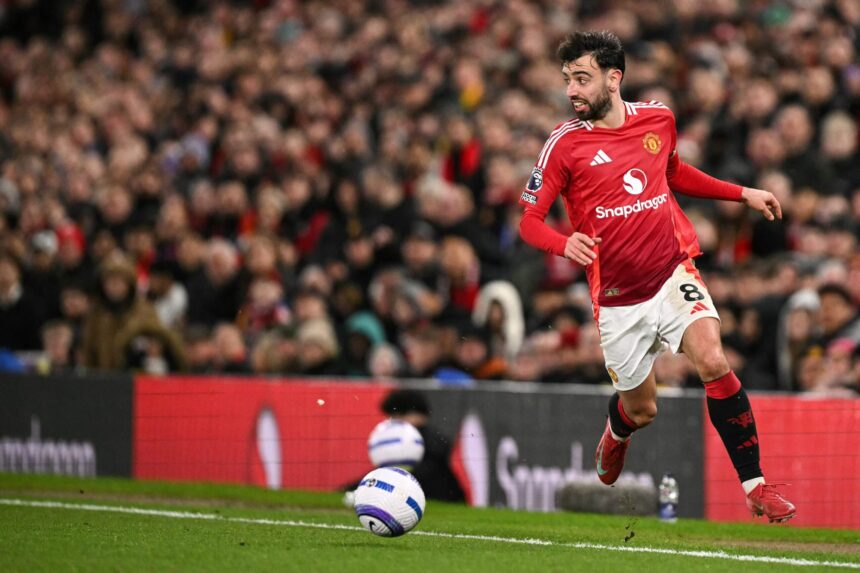
Bruno Fernandes: a talisman tax sort of player (Oli Scarff/AFP via Getty Images)
There has been previous work that has looked at this measure in football, but things do get a little trickier given how low-scoring it is as a sport. Nevertheless, we can still find some signal in the data — but first, let’s have a rebrand.
While “usage rate” is a well-established term in basketball, it does sound like a notification you might receive on your phone’s battery health. Therefore, let’s spice things up by calling our term the “talisman tax”.
In this version of our new metric, we will look at the number of times a player had the last action within their team’s sequence of possessions. This will include goals and assists but will also include things like failed passes, failed take-ons, or wayward shots, essentially any occasion that a player looks to make something happen in the attacking zones of the pitch.
Looking at this as a share of the team’s total when the player was on the field gives us our talisman tax — often those who make or receive those trickier progressive passes that move their team upfield, or those that cap off an attacking sequence with a shot on goal.
Going down the top 20 list, the usual suspects helpfully rise to the top.
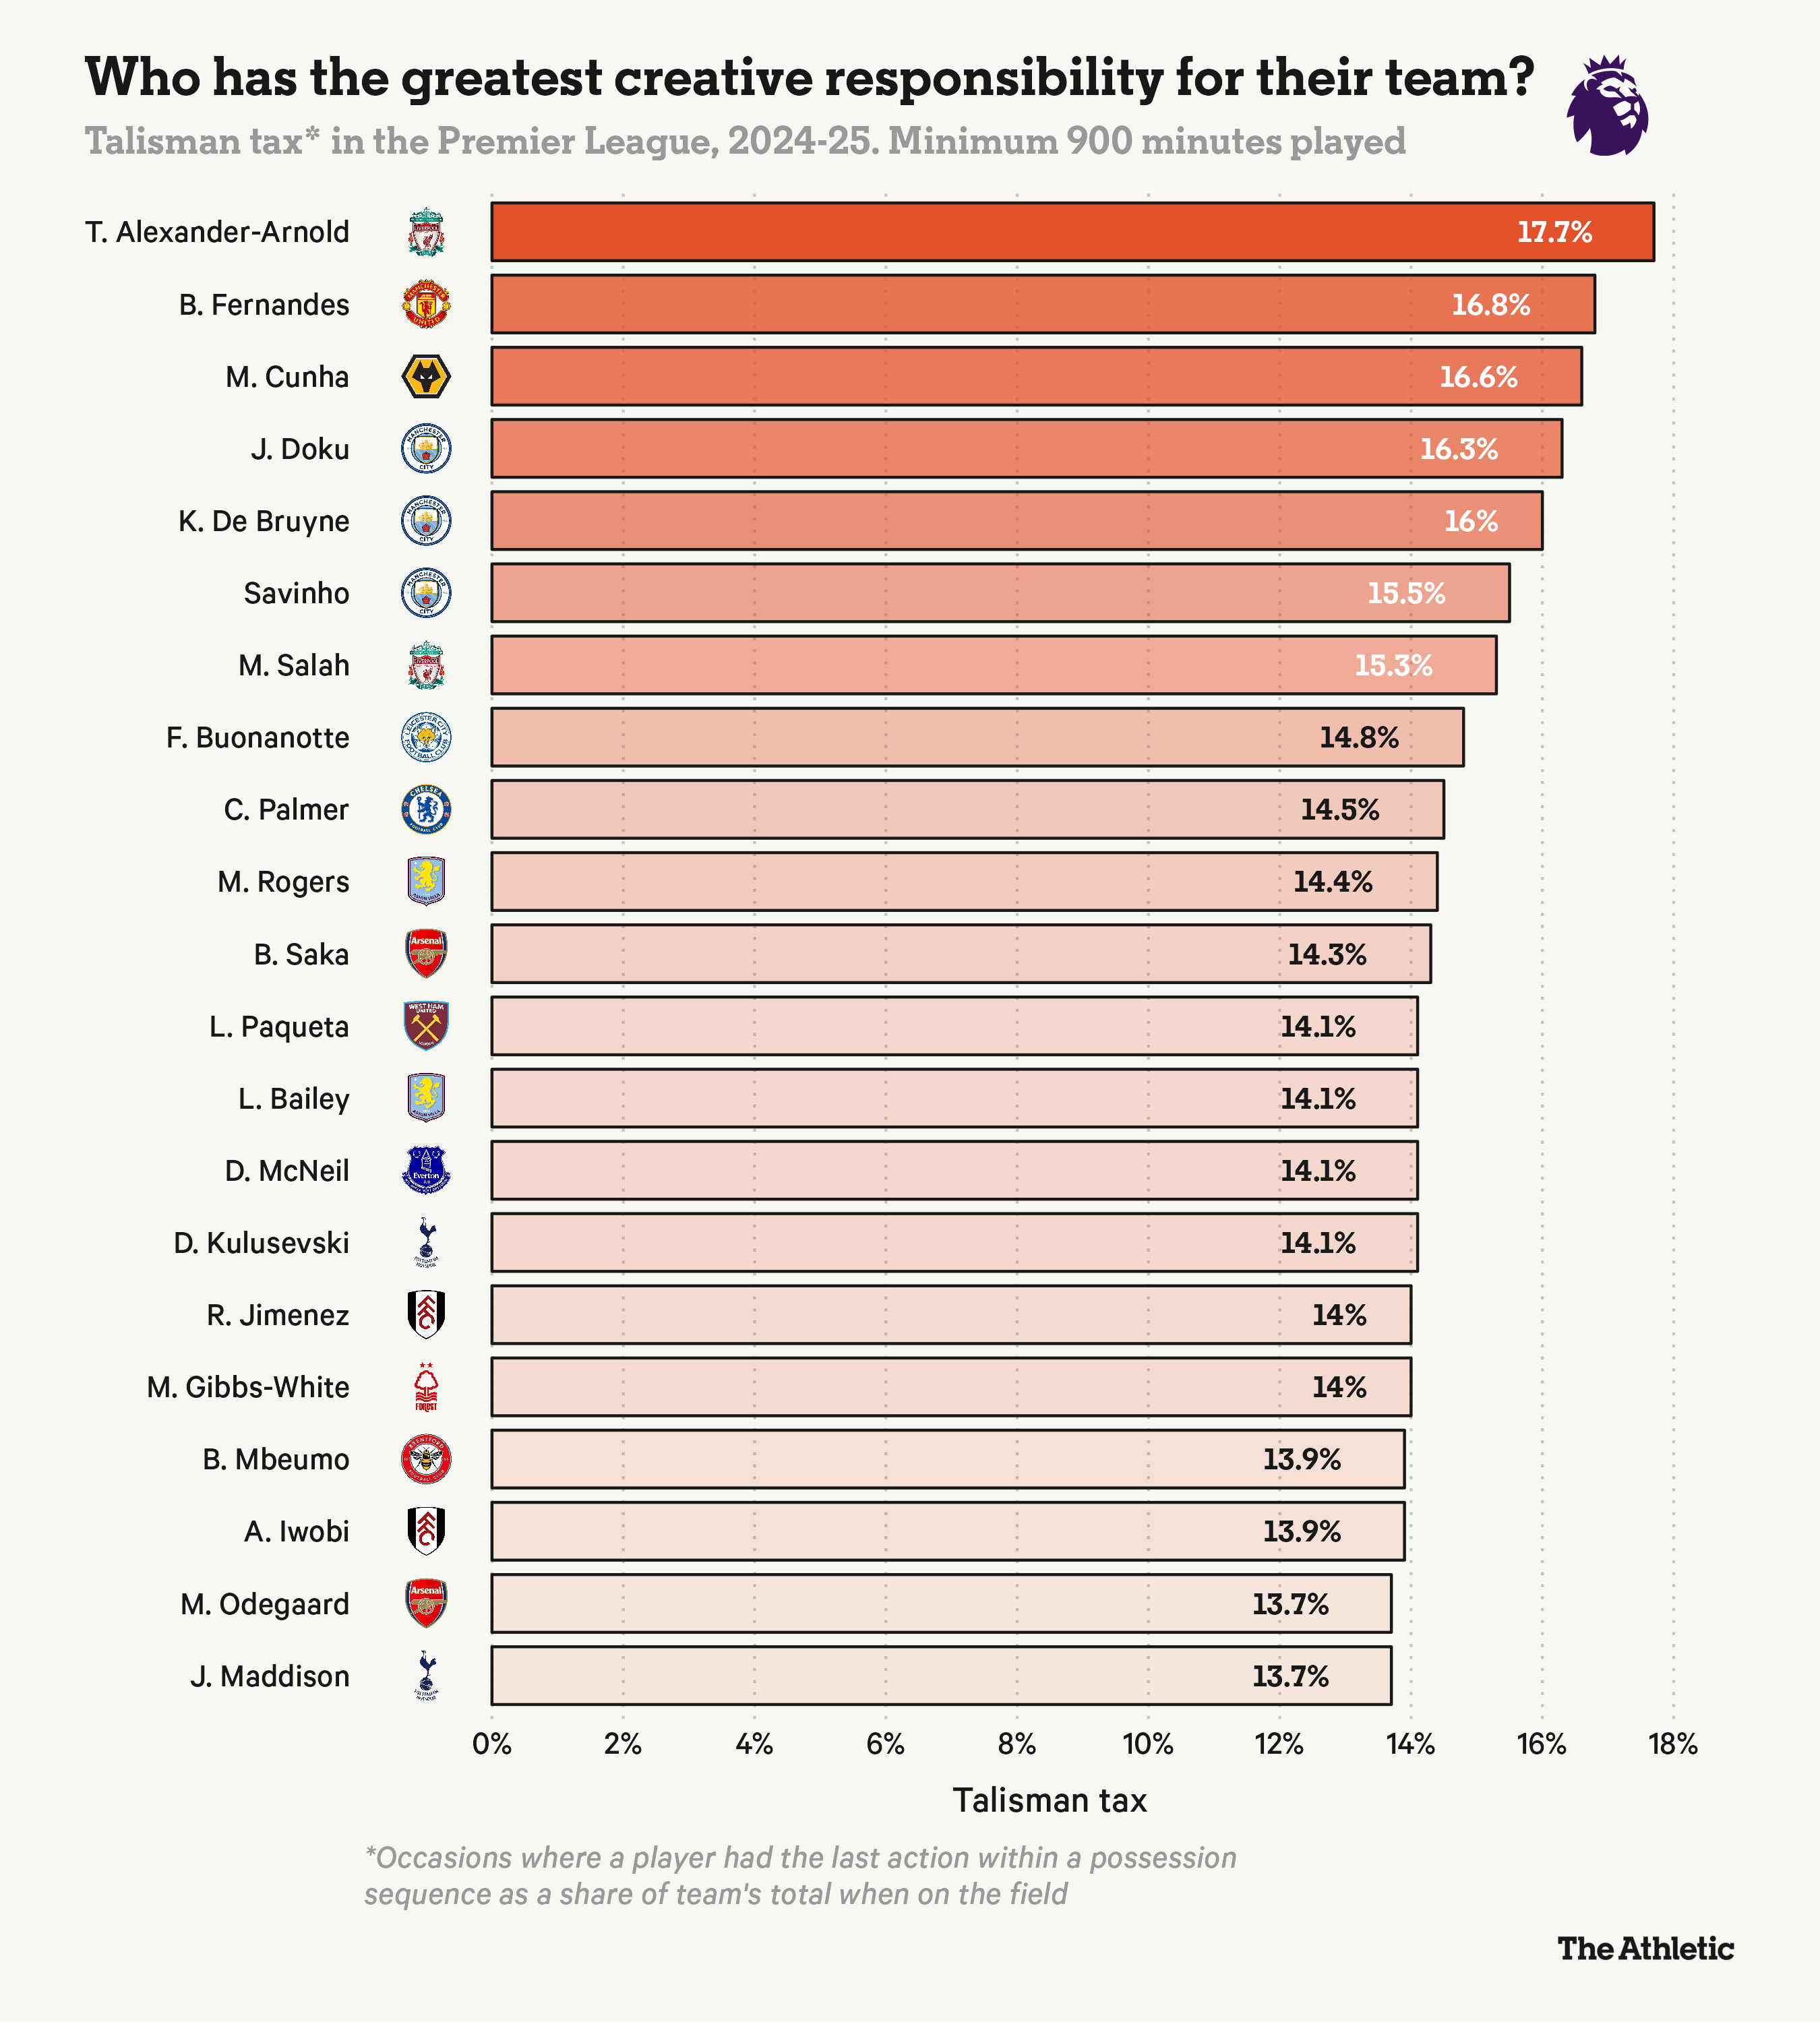

Notwithstanding the greater activity from set-piece takers, Liverpool’s Trent Alexander-Arnold and Manchester United’s Bruno Fernandes lead the way by this measure, as two archetypal players tasked with delivering searching balls in forward areas.
Three of Manchester City’s creative players make the top seven, while Wolves’ Matheus Cunha shows up as the highest talismanic player among teams in the bottom six.


Kevin De Bruyne and Jeremy Doku both score highly in our new metric (Carl Recine/Getty Images)
In truth, this is a statistic that is somewhat difficult to directly map to its wider use in basketball, but it can help to identify which teams might be focusing their efforts on one player within their creative diet.
Cunha’s Wolves are a good example of this. When looking at the dispersion of the talisman tax share across the squad, their No 10 scoops up a healthy amount of creativity compared with his team-mates this season.
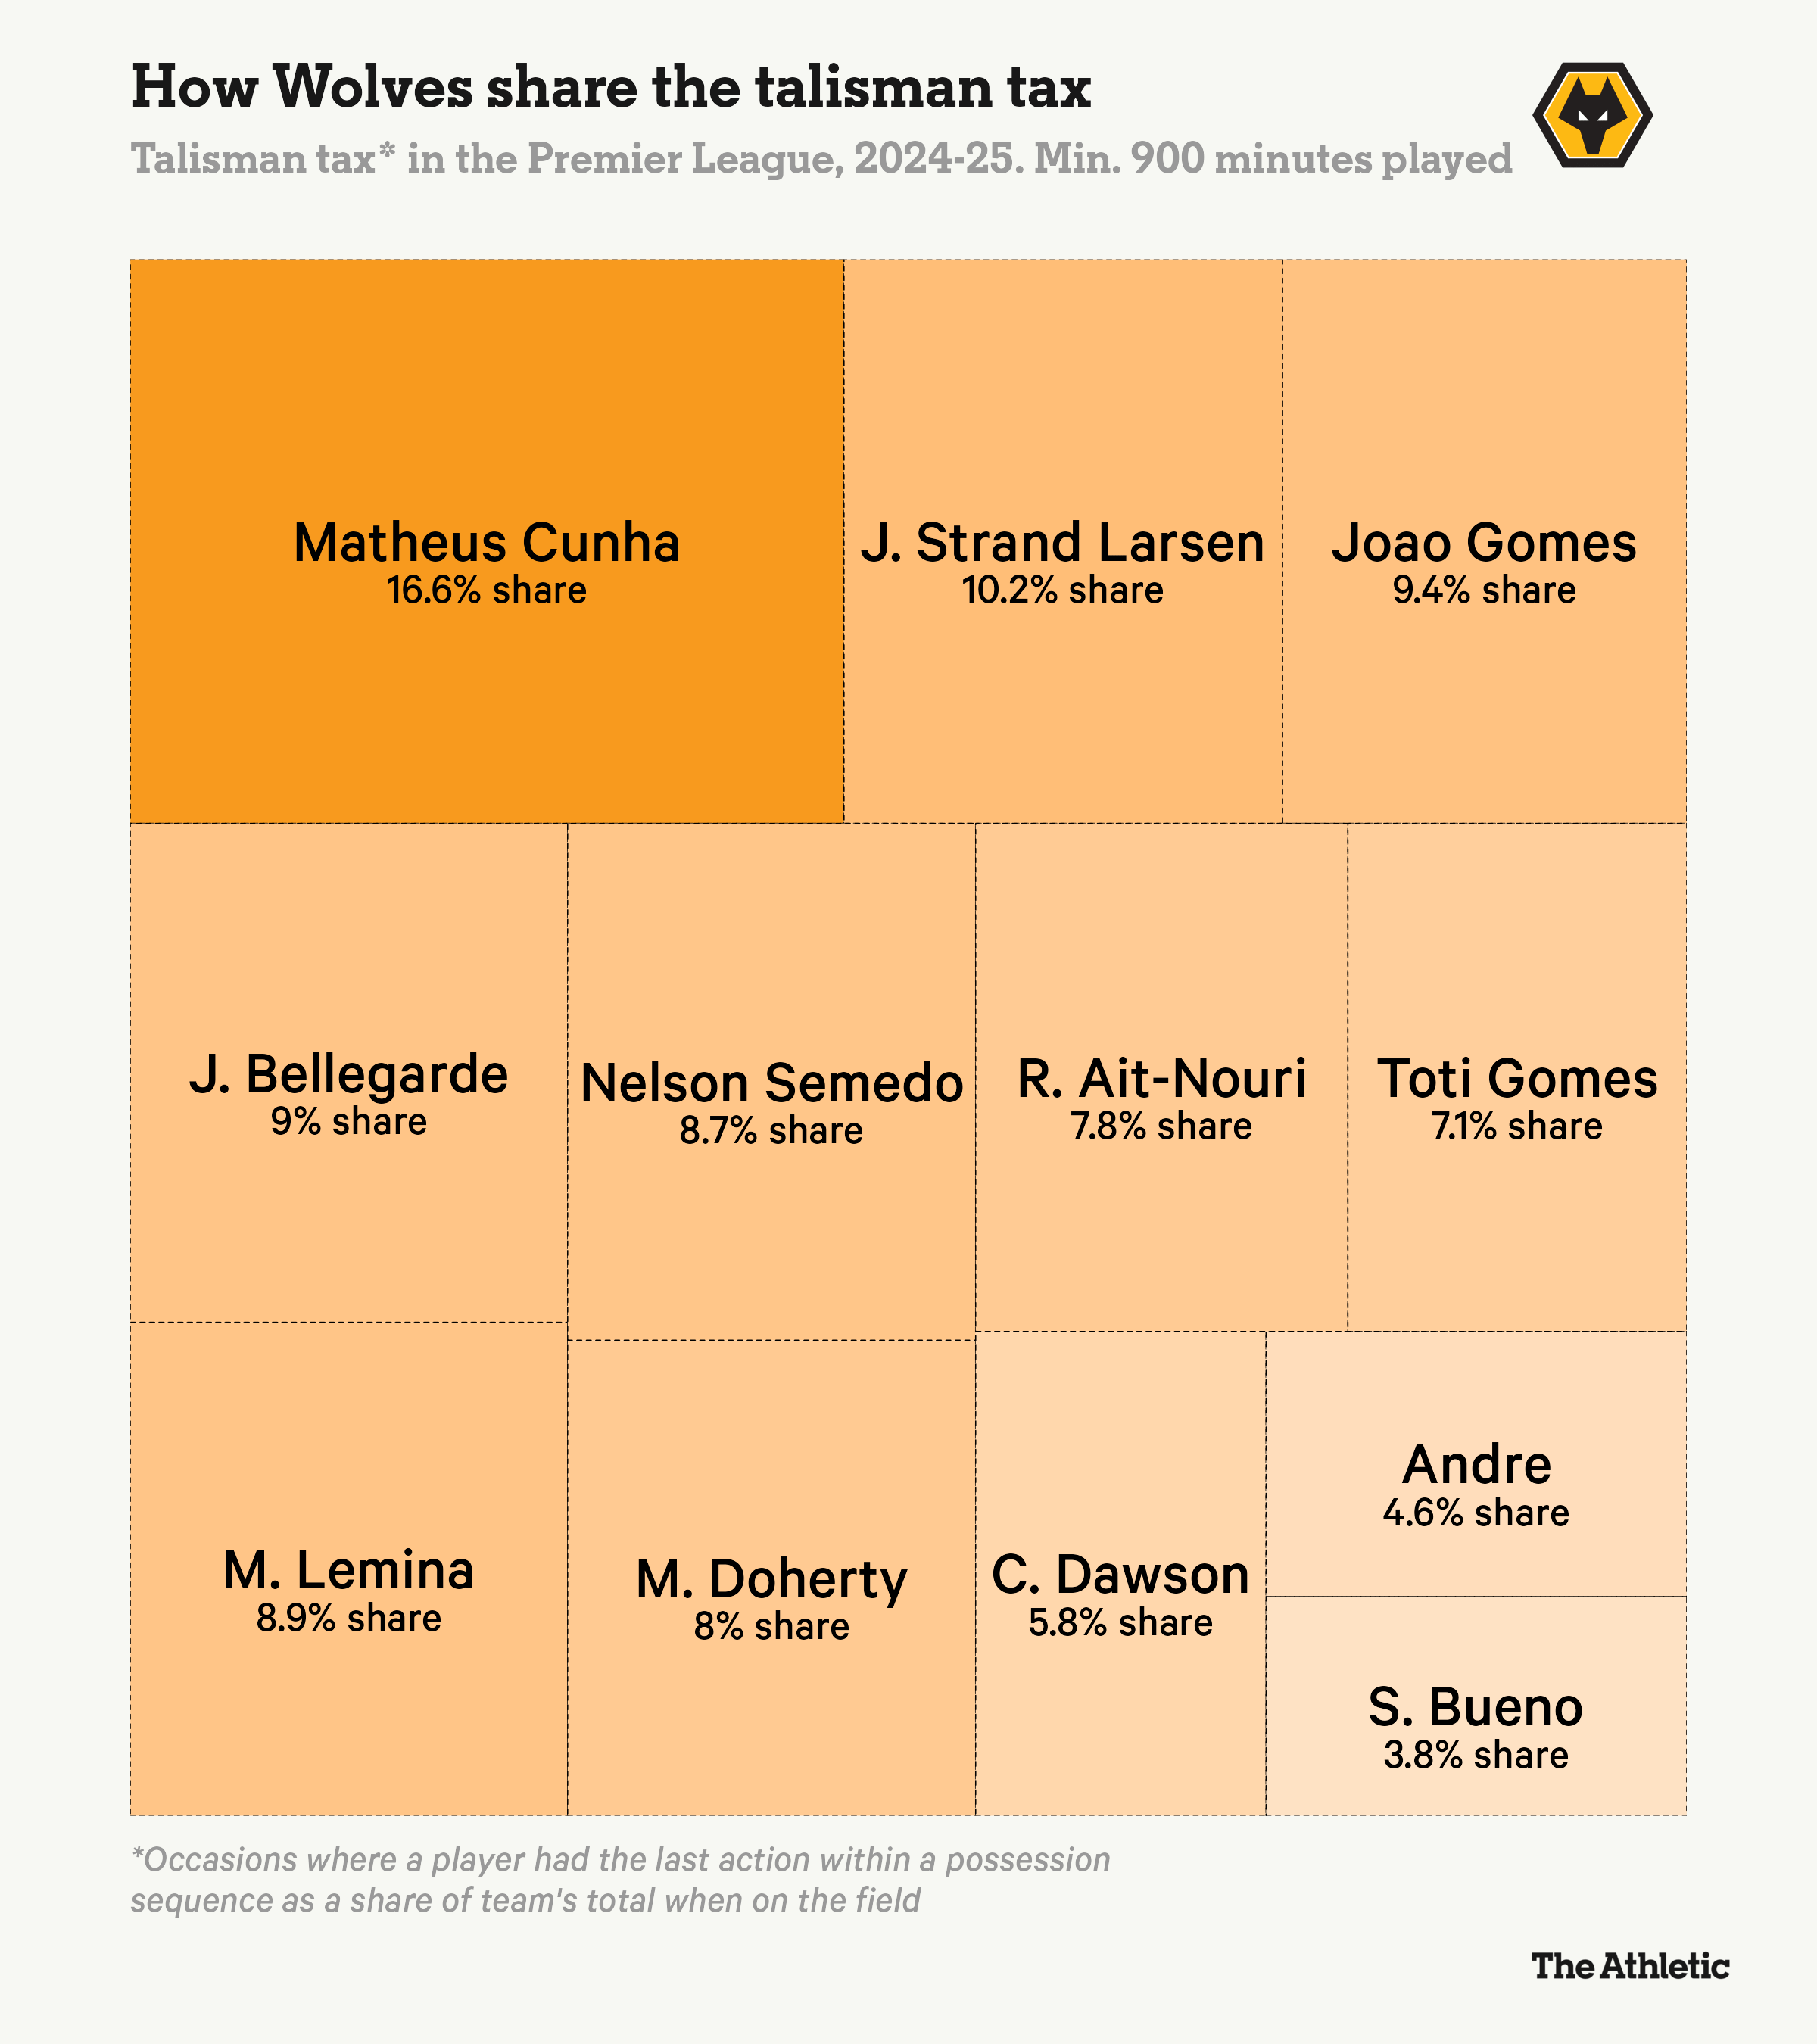

Compare that with Manchester City — who have multiple creative outlets from which to set up their attack — and you can see why Wolves’ approach might be a bit flawed.
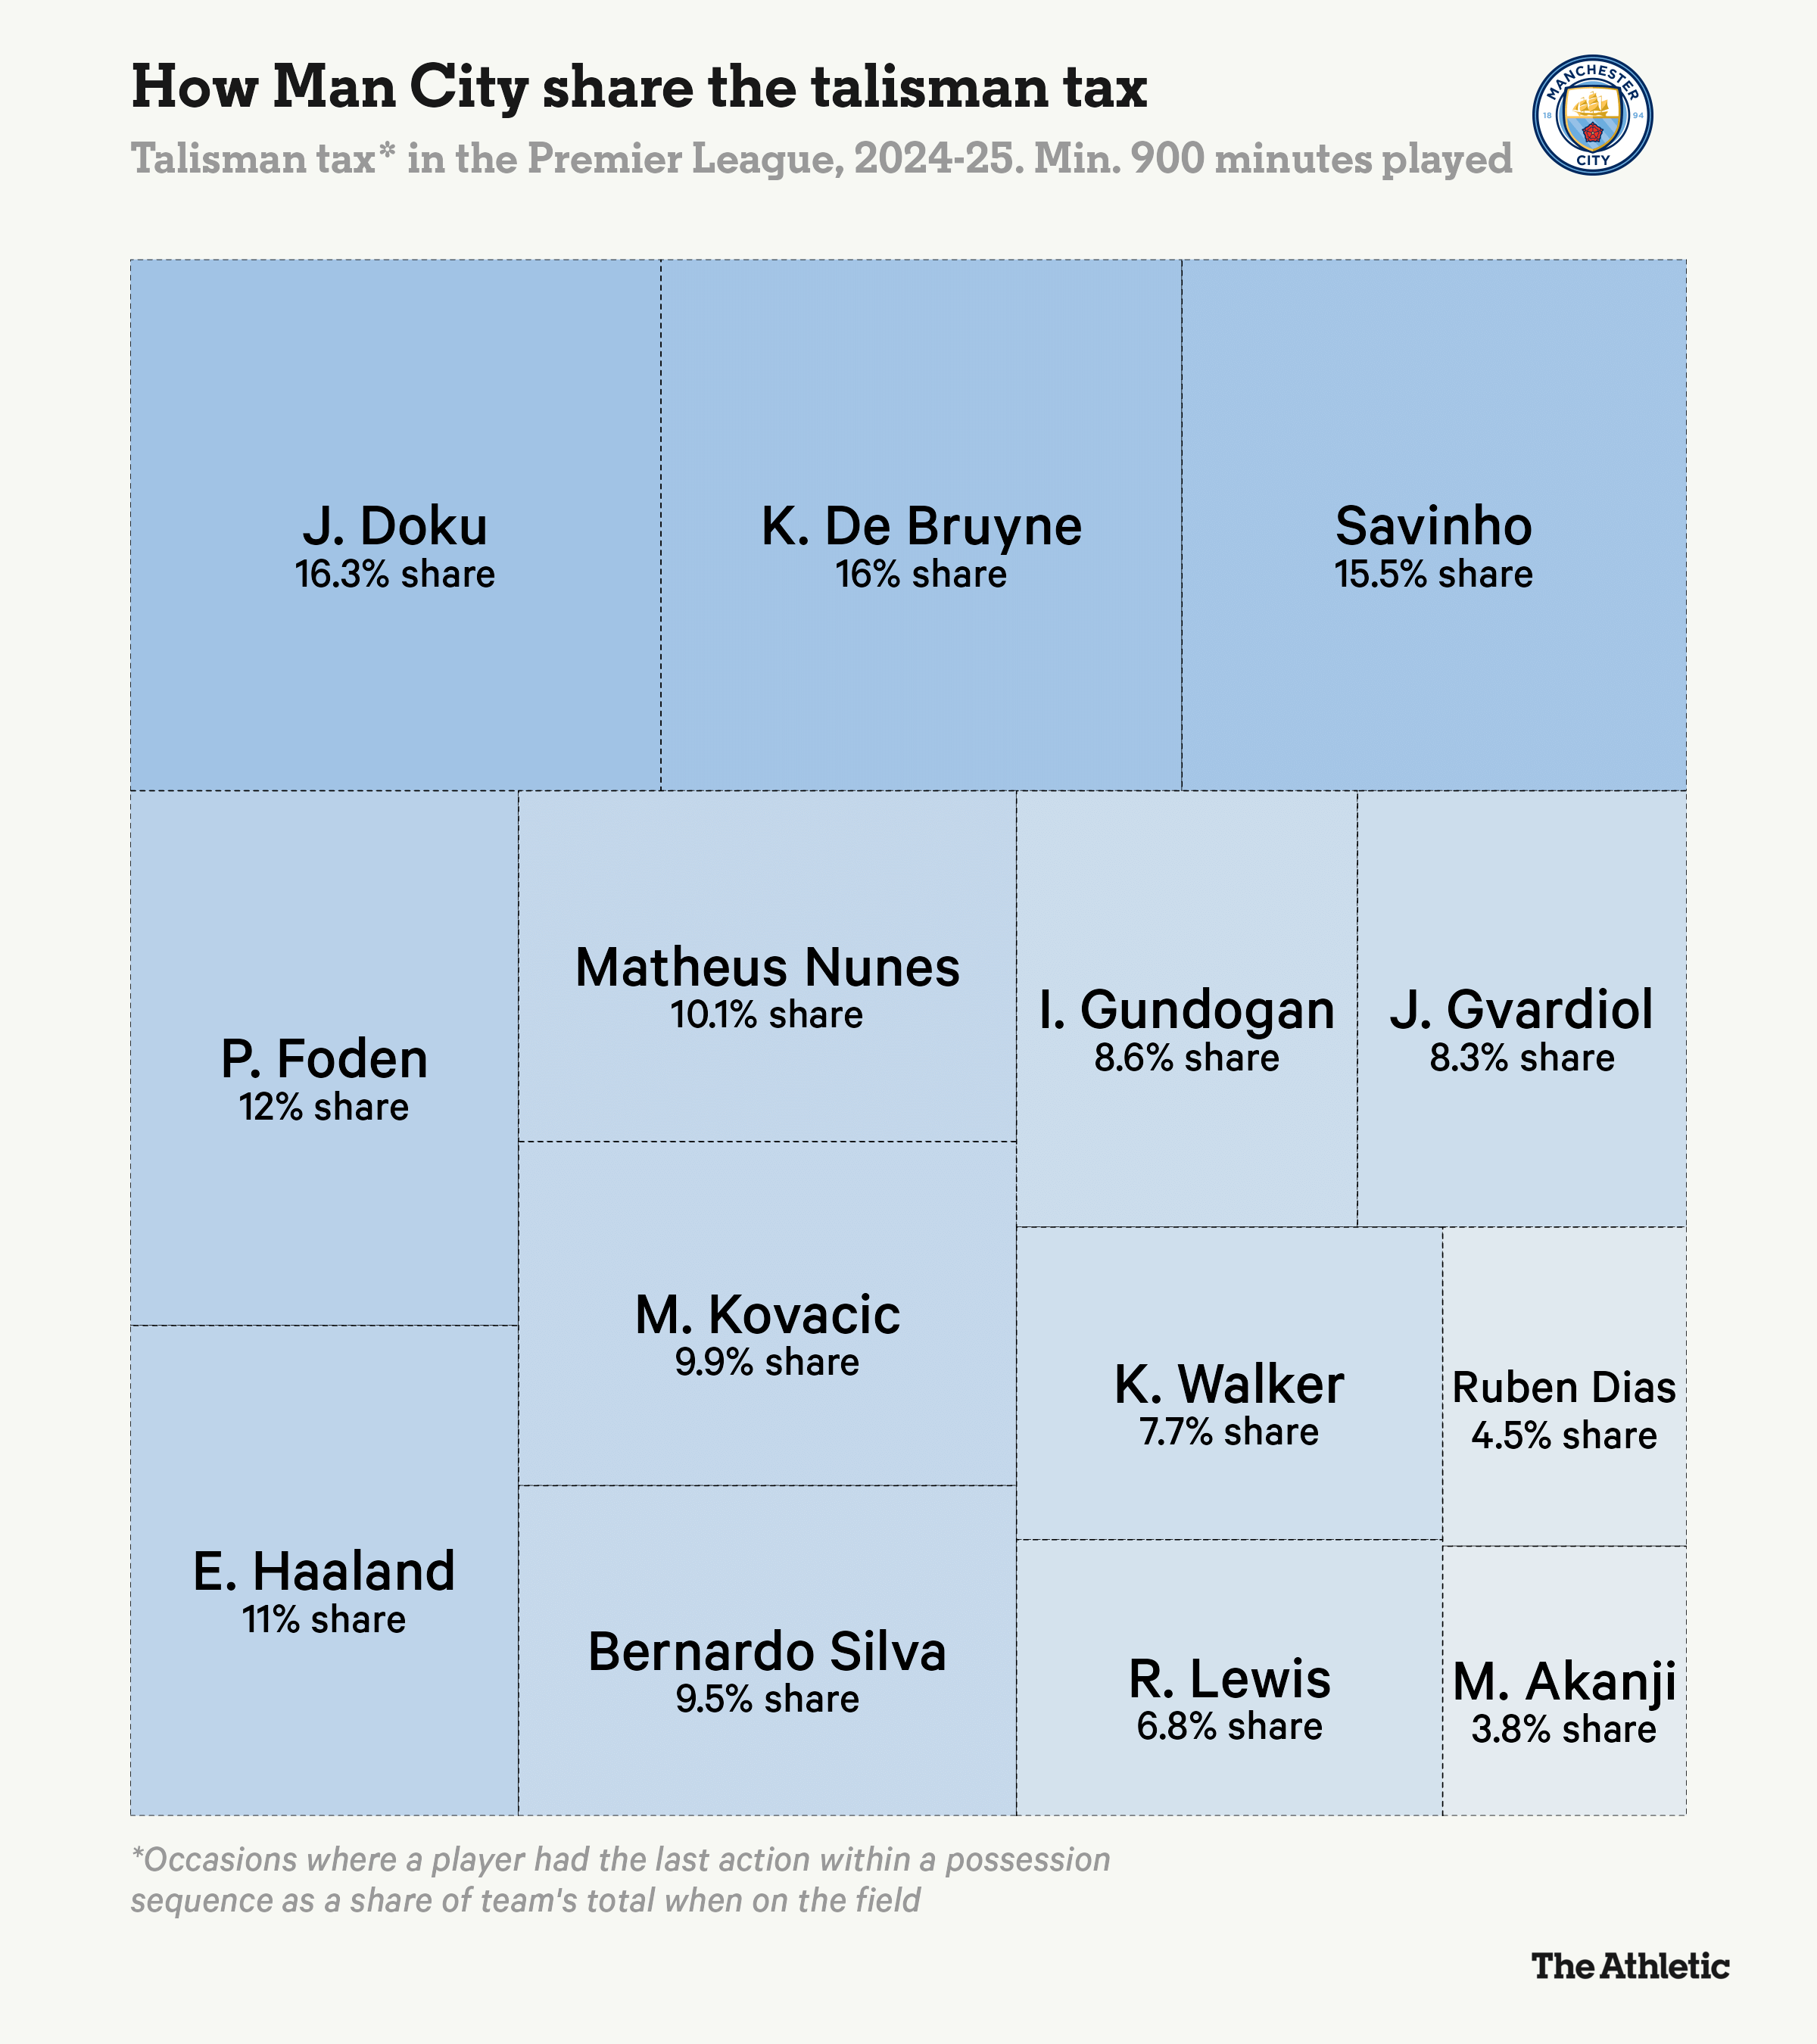
Having such a skewed focus on a single individual to create might lead to greater one-dimensionality within certain teams. If the creative player doesn’t play well, there is less chance of the team playing well, which can leave them susceptible to greater variance in their overall attacking performance.
Advertisement
Crucially, the talisman tax does not outline the efficiency or impact of the player at hand — we can leave that to the advanced metrics of expected threat (xT) and their synonymous friends — so how can it still be useful?
For one, it can help from an opposition analysis perspective in identifying which players are hoovering up the most attacking burden — allowing teams to plan their approach in nullifying the biggest threat.
More pertinently, this measure can be useful in a recruitment context when adjusting the weight of a player’s attacking output relative to their importance within their respective team.
Let’s return to Wolves’ Cunha. In the aggregated numbers, you can make a strong case that the 25-year-old is having an excellent, if somewhat ill-disciplined season — which he is — with a career-best 13 league goals (0.55 per 90).


However, when considering how much of Wolves’ attack is channelled through Cunha, would he have the same level of output if he saw less of the ball in an elite team with more of an equitable attacking approach? Think Jack Grealish at Aston Villa versus at Manchester City, for example.
Much in the same way that The Athletic has previously emphasised the importance of adjusting attacking numbers per 100 touches to account for opportunity, seeing how involved a player is in their respective attack allows us to contextualise those “per 90” numbers even further — and better understand how well a player is performing with the limited time they have on the ball.
A similar story could be said for Ipswich Town’s Liam Delap, or Southampton’s Tyler Dibling — two players who have shone in any otherwise disappointing campaign in their team’s fortunes at the bottom of the Premier League table. If established Premier League teams were to look at either player’s attacking numbers, adding the talisman tax provides an extra layer when considering the scalability of their skill set in a higher-quality side.
Let it be clear that the talisman tax points to a player’s — or team’s — style more so than substance, but it can act as an important factor to consider when scouring through the list of players with the highest expected goals or expected assists across Europe.
(Header photos: Getty Images)


